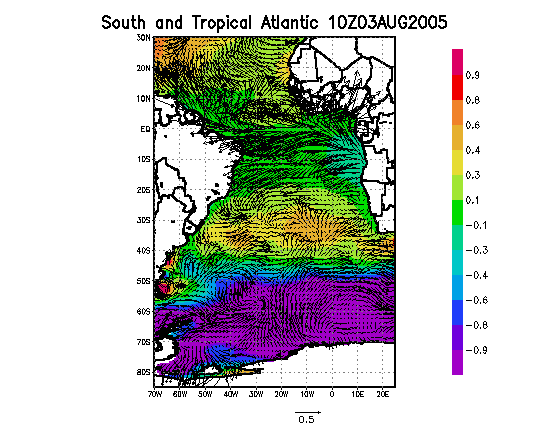
Fig. 1 - Instantaneous model results - surface currents (m/s) and elevations (shaded, in m) - for the South and Tropical Atlantic.
Joseph Harari 1 & Ricardo de Camargo 2 & Carlos Augusto de Sampaio França 3
1 joharari@usp.br ; 2 ricamarg@model.iag.usp.br ; 3 cafranca@usp.br
1,3 Institute of Oceanography
2 Institute of Astronomy, Geophysics and Atmospheric
Sciences
University of Sao Paulo - SP - Brazil
simulations of situations of interest (typical or extreme) and operational forecasts;
processing of high resolution nested grids, to represent the transition of the circulation characteristics from the deep ocean to shelf areas.
Fig. 1 - Instantaneous model results - surface currents (m/s) and elevations (shaded, in m) - for the South and Tropical Atlantic.
Present publication is concerned with the processing of high resolution grids, to represent the circulation characteristics in shelf areas, with emphasis in the Brazilian coast, where grid spacings progressively decrease from 30' to 15', 10' and 5', in a process where the finer grids have boundary conditions specified by the coarser ones.
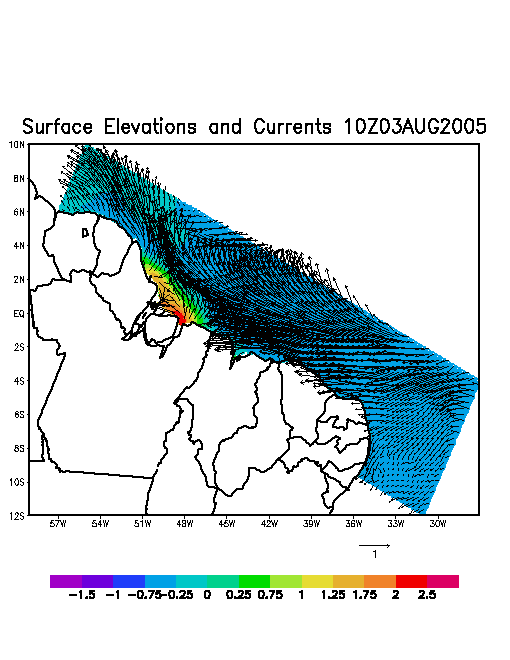
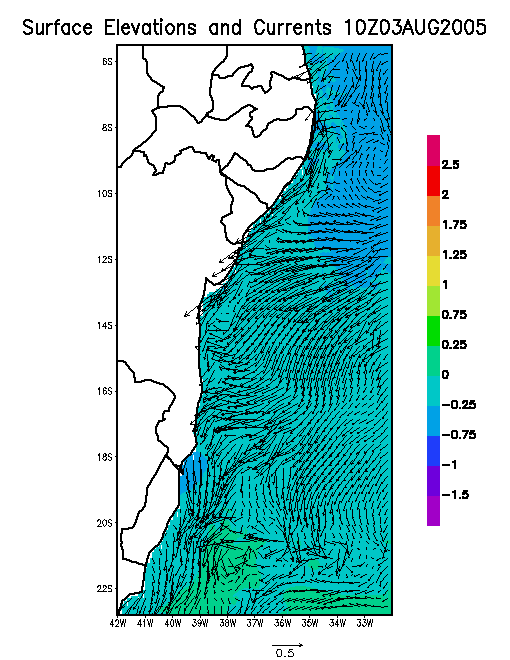
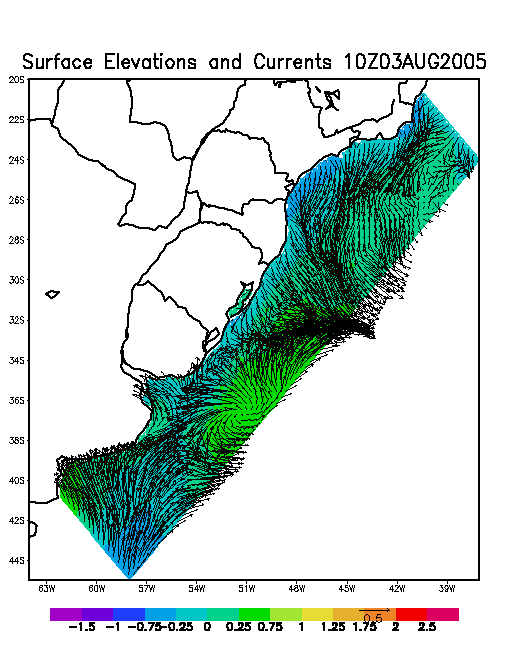
Figures 1 to 3 show instantaneous model results with tidal, winds and thermodynamic forcings, on 10:00 GMT 03 August 2005, for (1) the principal grid (30' spacing) and two nestings (5' spacing) of the following Brazilian coastal areas and neighbour deep oceans - E, NE and N (Fig. 2) and S, SE and E (Fig. 3). Figures 4 (a, b, c) show three other nestigns (5' spacing), with grid axes oriented parallel and perpendicular to the coast line, in norhtern, eastern and southern Brazil, respectively.
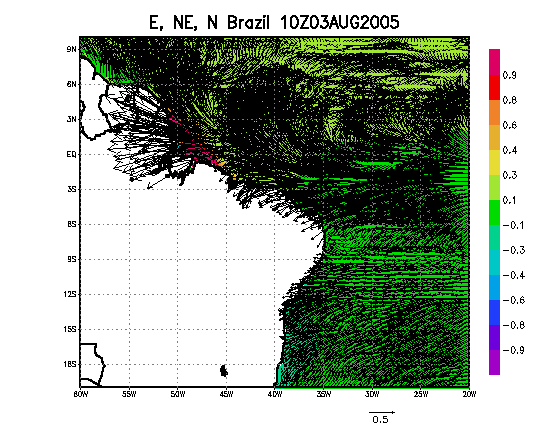
Fig. 2 - Instantaneous model results - surface currents (m/s) and elevations (shaded, in m) - for the nesting covering E, NE and N Brazil, and adjacent deep ocean.
The model has reproduced fairly well the
principal features of the tidal and general circulations, as known from
independent measurements (satellite altimetry and "in situ" data) and other
large scale models: for the whole model area, the intense currents at the
Equatorial region are predominant, enhanced by the tidal currents in the
North Brazilian shelf (Fig. 1); besides the strong tidal currents at the
Amazon Riven Mouth, the North Brazil Current Retroflexion is evident in
Fig. 2; and the turning of the South Equatorial Current originating the
Brazil Current is clearly shown in Fig. 3. More details of the shelf circulations
are presented on Fig. 4, such as the huge tidal elevation at the Amazon
river mouth (Fig. 4a), discontinuities in the Brazil Current (Fig. 4b)
and the Brazil – Malvinas Confluence (Fig. 4c).
Fig. 3 - Instantaneous model results - surface currents (m/s) and elevations (shaded, in m) - for the nesting covering S, SE and E Brazil, and adjacent deep ocean.
The model results have been evaluated through time series analyses, applied to surface elevations and currents at several levels, as well as depth-mean currents and transports, in each grid point. Long term model runs have provided series that include seasonal variations of the general circulation, which are especially important in the equatorial area and the Brazil – Malvinas Confluence.
In the next stage of researches, the inter-annual variability of the circulation will be evaluated, as done by Ezer (1999) for the North Atlantic, considering as model inputs the winds and temperature values at the surface generated by re-analyses of global operational meteorological models relative to long periods of time, of the order of decades (from 1980 to 2005).
In all the numerical experiments that have
been performed, the quality of the simulations are evaluated, by comparing
the hydrodynamic fields produced by model runs with direct measurements
(tide gauges and current meters) and remote sensing (altimeter satellites),
including coastal observations.
|
(a) |
(b) |
|
(c) |
Fig. 4 - Instantaneous results of the model for nested grids with axes oriented parallel and perpendicular to the coast line, in the Northern (a), Eastern (b) and Southern (c) Brazilian shelves. |
Operational predictions of the ocean circulation in the South and Tropical Atlantic, as given by the model outputs, are regularly available on:
Blumberg, A. F.; Mellor,
G. L. 1987 A description of a three-dimensional coastal ocean circulation
model. In: Heaps, N. S. (Ed.), Three-dimensional Coastal Ocean Models,
vol. 4, American Geophysical Union, Washington D. C., pp. 1 -16.
Ezer,T. 1999. Decadal
variabilities of the upper layers of the subtropical North Atlantic: An
ocean model study. J. Phys. Oceanogr. 29 (12), 3111-3124.
Ezer,T.; Mellor, G.
L. 1994. Diagnostic and prognostic calculations of the North Atlantic circulation
and sea level using a sigma coordinate ocean model. J. Geophys. Res. 99,
p. 14,159 – 14,171.
Ezer,T.; Mellor, G.
L. 1997. Simulations of the Atlantic Ocean with a free surface sigma coordinate
ocean model. J. Geophys. Res. 102(C7), 15,647-15,657.
Ezer, T.; Mellor, G. L. 2000. Sensitivity
studies with the North Atlantic sigma coordinate Princeton Ocean Model.
Dynamics of Atmospheres and Oceans 32 (2000), 185 – 208.
Levitus, S.; Conkright,
M. E.; Boyer, T. P.; O’Brien, T.; Antonov, J.; Stephens, C.;
Stathoplos, L.; Johnson, D.; Gelfeld, R. 1998. World Ocean Database 1998,
vol. 1, Introduction (CD-ROMs), NOAA Atlas NESDIS 18, U. S. Govt. Print.
Off., Washington, D. C. , 346 pp.
Webb, D. J.; Cuevas,
B. A.; Coward, A. C. 1998. The first main run of the OCCAM global ocean
model. Southampton Oceanography Center, Internal Report 34, 43 pp.